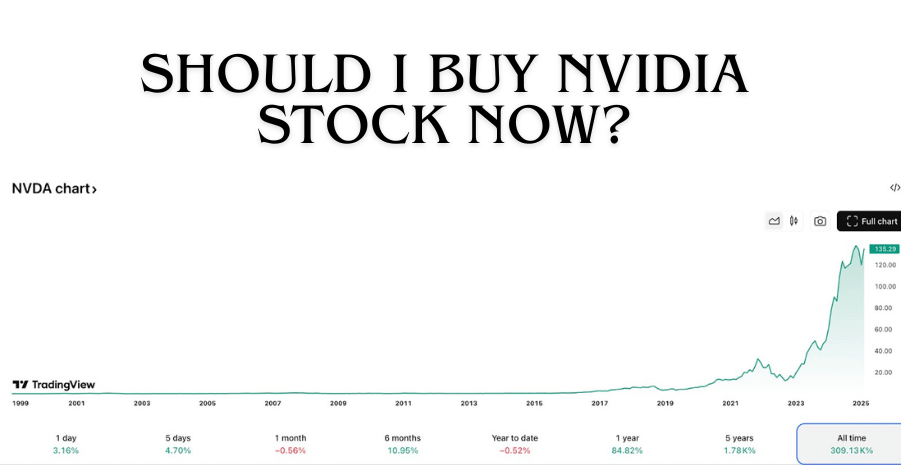
The question is really two questions, and conflating them is how most retail investors get hurt.
No article can answer “should I buy NVIDIA stock now” for you — not this one, not a YouTube thumbnail, not a price target — because the answer depends on your time horizon, your tax situation, how much technology exposure you already own, and how you would actually behave if the position fell 40% in six weeks. What a page can honestly do is put the current, dated, verifiable numbers in front of you and lay out the framework analysts use, so you can run the decision yourself. That is what this page does, and the sections below are organized around that goal rather than a verdict.
Disclaimer: this article is information and education, not financial advice. The author is not a licensed financial advisor, broker, or registered investment adviser. Nothing here is a recommendation to buy, sell, or hold NVIDIA Corporation (NASDAQ: NVDA) or any other security. Share prices and valuation multiples change every trading day, so every figure below is labeled with the date it was accurate. Confirm anything that matters against primary filings, and consider talking to a licensed professional about your own circumstances.
Where NVIDIA Stands as of August 2, 2026
Start with the scoreboard. The figures below come from S&P Global Market Intelligence data compiled by StockAnalysis, reflecting the July 31, 2026 close with the data set last refreshed August 1, 2026. Treat the price and market cap as stale the moment the market reopens; treat the trailing fundamentals as good until the next earnings report.
| Metric | Figure | As of |
|---|---|---|
| Share price | $200.75 | July 31, 2026 close |
| Market capitalization | $4.86 trillion | July 31, 2026 |
| 52-week range | $164.07 – $236.54 | July 31, 2026 |
| Trailing P/E | 30.74 | August 1, 2026 data refresh |
| Forward P/E | 20.11 | August 1, 2026 data refresh |
| Price/sales | 19.18 | August 1, 2026 data refresh |
| EV/EBITDA | 29.13 | August 1, 2026 data refresh |
| Revenue (trailing 12 months) | $253.49 billion | August 1, 2026 data refresh |
| Net income (trailing 12 months) | $159.61 billion | August 1, 2026 data refresh |
| Operating margin | 64.02% | August 1, 2026 data refresh |
| Shares outstanding | 24.22 billion | August 1, 2026 data refresh |
| Analyst consensus | “Strong Buy,” average 12-month target $302.83 (61 analysts) | August 1, 2026 |
Two rows deserve a second look. A trailing P/E of 30.74 is unremarkable for a mega-cap growth name, surprising anyone who assumes NVIDIA is priced for perfection. The forward P/E of 20.11 is lower still — but only because consensus assumes earnings keep compounding at the current pace; a forward multiple is an opinion wearing a number’s clothing. The price/sales ratio of 19.18 is what bears cite, since it depends on no forecast.

The Last Reported Quarter, in Actual Numbers
NVIDIA reported first-quarter fiscal 2027 results on May 20, 2026, covering the quarter that ended April 26, 2026. These are the audited-track figures from NVIDIA’s Q1 FY2027 results filed with the SEC, cross-checked against NVIDIA’s own investor announcement.
| Line item | Q1 FY2027 | Year-over-year change |
|---|---|---|
| Total revenue | $81.6 billion | +85% |
| Data center revenue | $75.2 billion | +92% |
| Gaming and edge computing revenue | $6.4 billion | +29% |
| GAAP gross margin | 74.9% | up from 60.5% |
| GAAP operating income | $53.5 billion | +147% |
| GAAP net income | $58.3 billion | +211% |
| GAAP diluted EPS | $2.39 | +214% |
| Non-GAAP diluted EPS | $1.87 | +140% |
| Q2 FY2027 revenue guidance | $91.0 billion (±2%) | — |
Data center accounted for roughly 92% of total revenue. That single fact reframes the question: buying NVIDIA in 2026 is not a diversified bet on graphics, gaming, and automotive but a concentrated bet on AI infrastructure spending by a handful of very large buyers. Alongside results, NVIDIA raised its quarterly dividend from $0.01 to $0.25 per share (paid June 26, 2026) and authorized an additional $80.0 billion in buybacks, returning about $20.0 billion during the quarter.

Bull Case vs. Bear Case, With the Data Behind Each Claim
Most articles on this topic give you adjectives. Here are the arguments paired with the figures each rests on.
| Issue | Bull case and the data behind it | Bear case and the data behind it |
|---|---|---|
| Growth rate | Data center revenue grew 92% to $75.2 billion in Q1 FY2027; Q2 guidance of $91.0 billion implies another step up. | An 85% growth rate cannot repeat indefinitely off a base this large, and deceleration re-rates a stock priced at 19x sales. |
| Margins | GAAP gross margin of 74.9% and operating margin above 64% are software-like economics on hardware. | Margins that high attract competitors; any pricing concession compresses them fast. |
| Customer base | Buyers are the best-capitalized companies on earth, with 2026 capex already committed. | Four customers were 61% of revenue in the quarter ended Oct 26, 2025; three were 64% of receivables at April 26, 2026. |
| Competition | NVIDIA reserved over half of TSMC’s 2026 advanced packaging capacity; rivals face the same bottleneck. | AMD posted $37.45 billion trailing revenue; Google expects ~4.3 million TPU shipments in 2026. |
| Software moat | CUDA is a two-decade ecosystem; migration costs are engineering years, not purchase orders. | Google ships TorchTPU explicitly to move developers off the NVIDIA stack; inference ports most easily. |
| China | Washington licensed H200 sales to roughly 10 Chinese firms, reopening a market NVIDIA had lost. | Beijing is reportedly capping approvals below 200,000 chips, under half of what was requested, and restricting use to training. |
| Demand durability | 2026 big-tech capex plans total roughly $725 billion, up about 77% from $410 billion. | AI revenue still trails infrastructure spending by hundreds of billions; divergence exceeds the 2001 telecom cycle. |
| Valuation | Forward P/E of 20.11 is modest for triple-digit earnings growth. | Price/sales of 19.18 and price/book of 24.87 leave no cushion if growth normalizes. |
The Four Bear Arguments Worth Understanding in Detail
1. Customer Concentration Is Extreme and Getting More So
NVIDIA does not name its largest customers but must disclose concentration. In the quarter ended October 26, 2025, four direct customers each exceeded 10% of revenue — 22%, 15%, 13% and 11%, or 61% combined, per The Motley Fool’s reading of the same disclosure. A year earlier, 10%-plus customers were about 36% of sales. The trend runs toward more concentration.
The most recent primary filing says the same from another angle. In the Form 10-Q for the quarter ended April 26, 2026, three direct customers accounted for 30%, 18% and 16% of accounts receivable as of April 26, 2026 — roughly 64% owed by three counterparties. If one cuts orders by a third for a quarter, the revenue line moves visibly. That is mechanical risk, independent of anyone’s view on AI.
2. Competition Now Comes From Two Directions at Once
The external competitor is AMD, which reported $37.45 billion in trailing-twelve-month revenue and a $776.41 billion market capitalization as of the July 31, 2026 close, per AMD’s reported financials and market data. AMD does not need to beat NVIDIA to hurt it — it only needs to give hyperscalers a credible second source, which changes pricing conversations.
The more structural threat is silicon built by NVIDIA’s own customers. Forbes analysis of Google’s TPU roadmap reports Google expects TPU shipments of about 4.3 million units in 2026, scaling toward 35 million by 2028, with a MediaTek-designed part targeting roughly 30% lower cost per inference operation. Amazon’s Trainium and Microsoft’s Maia run the same play, and every chip a hyperscaler builds is one it does not buy. The counterweight, per the same analysis: NVIDIA has reserved more than half of TSMC’s 2026 advanced packaging capacity and is projected to supply roughly 22% of the foundry’s revenue. The bottleneck is manufacturing, not design — and NVIDIA has booked most of it.
3. China Access Is Partial, Conditional, and Reversible
China exposure has moved from “banned” to “permitted under conditions” — better for NVIDIA, but not normal. TrendForce, summarizing Reuters and CNBC reporting on H200 import caps indicates the U.S. Commerce Department approved roughly 10 Chinese companies for up to 75,000 H200 chips each, while Beijing is expected to authorize fewer than 200,000 units in total, less than half the volume requested, steering them toward training while pushing domestic processors for inference. Two governments hold a veto over this revenue stream, and either can change policy without notice. Model China as an option, not a base case.
4. The Gap Between AI Capex Commitments and Realized AI Revenue
This is the argument that actually moves the stock on bad days. Tom’s Hardware’s tally of big-tech capex guidance puts 2026 capital-spending plans across Microsoft, Alphabet, Meta, and Amazon at roughly $725 billion, up about 77% from $410 billion in 2025 — extraordinary demand, and the direct source of NVIDIA’s growth.
The question is what those buyers earn back. Forbes on the widening AI capex-to-revenue gap cites Sequoia Capital’s estimate of an annual revenue gap in the hundreds of billions between AI infrastructure spending and AI ecosystem revenue, and notes the capex-to-revenue divergence running near 46%, wider than the roughly 32% divergence recorded in the 2001 telecom buildout. Real AI revenue does exist — the same piece points to AWS at roughly $150 billion annualized and Microsoft’s AI business at a $37 billion run rate growing 123% year over year — but the spending is currently arriving faster than the payback. NVIDIA’s revenue is a direct function of its customers’ willingness to keep funding that gap.
One filing detail belongs here. The same 10-Q reports inventories of $25.8 billion (up from $21.4 billion at fiscal year-end), manufacturing and supply commitments of $119 billion with $95 billion payable within the rest of fiscal 2027, and $30 billion of multi-year cloud commitments. Those numbers get uncomfortable if orders soften — and look prescient if they do not.
The Bull Arguments, Stated as Precisely
The CUDA software moat is the most durable. Two decades of libraries, compilers and framework integration make switching accelerators an engineering migration, not a purchasing decision — which is why Google shipping a dedicated TorchTPU translation layer is itself evidence of the wall’s height. Software moats erode slowly and visibly, giving an investor time to react, unlike a demand shock.
The second is the growth-and-margin combination: very few companies this size grow data center revenue 92% year over year at a 74.9% GAAP gross margin, and expansion from 60.5% a year earlier suggests pricing power rather than scale alone. The third is capital return capacity — $80.0 billion of newly authorized buybacks funded from operating cash, not debt.
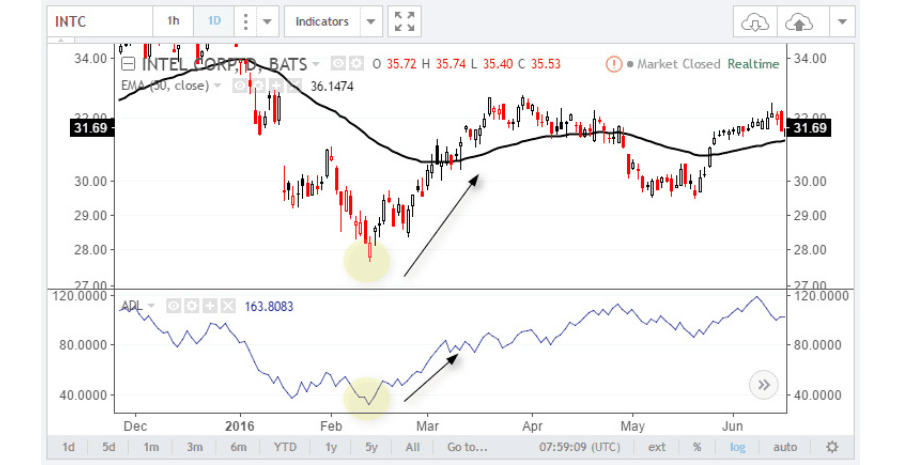
For perspective on how differently the market can price the same industry, why Intel stock trades so cheaply is a useful case study in what happens when investors stop believing a chipmaker’s moat.
A Framework You Can Actually Run
Instead of a verdict, here are the questions that determine the answer for your situation. Work through them honestly; the output is more useful than any price target.
- What is your holding period? A five-year horizon and a five-month horizon are answered by different data entirely.
- How much correlated exposure do you already have? If you hold an S&P 500 index fund, NVIDIA is already one of your largest positions by weight. Adding shares concentrates rather than diversifies.
- Which bear argument would change your mind? Write it down with a number attached — say, data center growth below a stated threshold for two straight quarters. A falsifiable trigger separates a thesis from a hope.
- Have you used your tax-advantaged room first? For many savers, filling employer-plan and retirement accounts — the annual 457(b) contribution ceiling is one example of such a limit — comes before single-stock positions, purely because of the tax arithmetic.
- Are you using borrowed money? Margin or credit changes the risk profile entirely, and deserves at least the same checks you would run before selecting a loan provider.
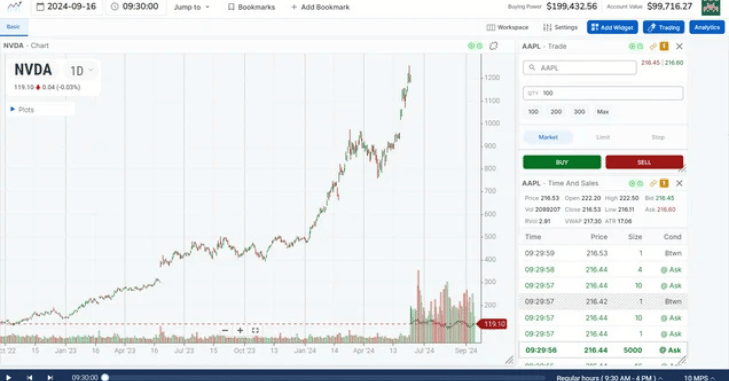
- Could you tolerate the historical drawdown? The 52-week range spans $164.07 to $236.54 — a roughly 30% swing in a year of record results.
What to Watch Next, Specifically
NVIDIA reports second-quarter fiscal 2027 results on Wednesday, August 26, 2026, at 2 p.m. Pacific / 5 p.m. Eastern, covering the quarter ended July 26, 2026, per NVIDIA’s July 29, 2026 conference-call notice. That is the next real information event. Rather than reacting to the headline revenue figure, these lines carry the most signal:
- Data center revenue versus the $91.0 billion total guidance. Guidance was for total company revenue; the data center share tells you whether the mix is still tightening.
- Sequential growth rate, not year-over-year. Quarter-over-quarter was +21% in data center last quarter. Year-over-year comparisons flatter a business coming off a smaller base.
- Gross margin versus the 75.0% non-GAAP guide. A miss here is the earliest visible sign of competitive pricing pressure.
- The customer concentration disclosure in the 10-Q. Whether the count of 10%-plus customers rises or falls is the most underread line in the filing.
- Inventory and purchase commitments. Rising inventory alongside decelerating revenue is the classic semiconductor warning sign.
- China revenue disclosure or guidance commentary. Management framing on H200 volumes tells you whether to model China as upside or noise.
The Honest Bottom Line
As of August 2, 2026, NVIDIA is a $4.86 trillion company growing data center revenue 92% year over year at a 74.9% gross margin, trading at 30.7 times trailing earnings, with roughly 61% of a recent quarter’s revenue coming from four customers and its largest growth driver dependent on a spending cycle whose payback is not yet proven. Every one of those clauses is true at the same time. Which ones dominate your decision depends on facts about you, not facts about NVIDIA.
The most useful thing this page can leave you with is not a rating but a habit: pull the primary filings yourself, write down the number that would falsify your thesis, and check it every quarter. That works whether the stock rises or falls — more than can be said for any prediction, including the consensus $302.83 target above. Analyst targets are constantly revised inputs, not conclusions.
Questions Investors Are Asking Right Now
What did NVIDIA report in its most recent quarter?
NVIDIA reported first-quarter fiscal 2027 results on May 20, 2026, for the quarter ended April 26, 2026. Revenue was $81.6 billion, up 85% year over year, with data center revenue of $75.2 billion, up 92%. GAAP diluted EPS was $2.39 and GAAP gross margin was 74.9%. The company guided to $91.0 billion (plus or minus 2%) in revenue for the second quarter.
What is NVIDIA’s P/E ratio and market cap in August 2026?
As of the July 31, 2026 close, NVIDIA traded at $200.75 with a market capitalization of about $4.86 trillion, a trailing P/E of 30.74 and a forward P/E of 20.11. Its price/sales ratio was 19.18 and EV/EBITDA was 29.13. These multiples change every trading day, so verify current figures before using them in any analysis.
When is NVIDIA’s next earnings report, and which numbers matter most?
NVIDIA will report second-quarter fiscal 2027 results on Wednesday, August 26, 2026, at 5 p.m. Eastern, covering the quarter ended July 26, 2026. The most informative lines are data center revenue against the $91.0 billion total guidance, sequential rather than year-over-year growth, non-GAAP gross margin against the 75.0% guide, and the customer concentration disclosure in the accompanying 10-Q.
How concentrated is NVIDIA’s customer base?
Very. In the quarter ended October 26, 2025, four direct customers each exceeded 10% of revenue, at 22%, 15%, 13% and 11%, totaling about 61%. In the 10-Q for the quarter ended April 26, 2026, three direct customers represented 30%, 18% and 16% of accounts receivable. NVIDIA does not name these customers, but the disclosure means a single large buyer reducing orders would be visible in reported results.
Can NVIDIA sell AI chips in China in 2026?
Partially and conditionally. Reporting compiled by TrendForce indicates the U.S. Commerce Department approved roughly 10 Chinese companies to purchase up to 75,000 H200 chips each, while Beijing is expected to authorize fewer than 200,000 units in total, less than half the requested volume, with the chips steered toward AI training rather than inference. Because two governments control access, China revenue is best treated as a variable rather than a stable base.
What are the biggest risks to NVIDIA’s results that analysts point to?
The four most commonly cited are customer concentration, competition from AMD plus in-house silicon at hyperscalers such as Google’s TPUs and Amazon’s Trainium, export-control exposure to China, and the gap between announced AI capital spending and realized AI revenue. On that last point, 2026 big-tech capex plans total roughly $725 billion, up about 77% from 2025, while estimates cited by Forbes put the capex-to-revenue divergence near 46%, wider than the 2001 telecom cycle. None of these are predictions; they are the specific variables to monitor each quarter.
Filings, Data and Analyst Coverage
- S&P Global Market Intelligence data compiled by StockAnalysis — stockanalysis.com
- NVIDIA’s Q1 FY2027 results filed with the SEC — sec.gov
- NVIDIA’s own investor announcement — nvidianews.nvidia.com
- The Motley Fool’s reading of the same disclosure — fool.com
- Form 10-Q for the quarter ended April 26, 2026 — sec.gov
- AMD’s reported financials and market data — stockanalysis.com
- Forbes analysis of Google’s TPU roadmap — forbes.com
- TrendForce, summarizing Reuters and CNBC reporting on H200 import caps — trendforce.com
- Tom’s Hardware’s tally of big-tech capex guidance — tomshardware.com
- Forbes on the widening AI capex-to-revenue gap — forbes.com
- NVIDIA’s July 29, 2026 conference-call notice — quiverquant.com